"When governance forsakes justice, unrest becomes the currency of the oppressed"

-DataBAEs, 2024

Know More

Overview

Welcome to our project, Analyzing Economic Indicators and Political Violence in the Philippines, part of the dynamic initiative "PiNut 2023: Pilipinas in a Nutshell." Through the application of Data Science concepts to real-world data, we are committed to extracting actionable insights and addressing significant challenges. Aligned with Sustainable Development Goal (SDG) 16: Peace, Justice, and Strong Institutions, our work aims to foster societal betterment within the Philippines.

Motivation

The Philippines has long been riddled by persistent social issues such as poverty, unemployment, crime, and political violence, among others. Different administrations have attempted to resolve these issues through varying strategies and efforts. Economic indicators serve as crucial metrics for assessing the performance of government leaders in addressing the financial concerns and state of the country. Moreover, we believe that strengthening financial institutions would enhance the delivery of essential services to citizens, thereby alleviating hardships in areas such as healthcare, employment, and education. Consequently, this could mitigate the necessity for protests to advocate for these rights, leading to increased citizen satisfaction.

Problem

Political violence in the Philippines is a multifaceted issue fueled by various social, economic, and political factors. Stemming from deep-seated social inequalities, dissatisfaction with government performance, and economic instability, it manifests as a means for marginalized communities to voice grievances and demand change. Economic hardship exacerbates tensions, while inadequate government services compound citizen dissatisfaction, creating unrest. Addressing these root causes necessitates comprehensive strategies that prioritize social justice, economic development, and good governance.

Solution

Our project employs advanced data science techniques to explore the relationship between economic indicators and political violence in the Philippines. Through analysis of comprehensive datasets on political violence and economic metrics, we aim to uncover key drivers and develop predictive models to anticipate outbreaks based on economic shifts. These insights will equip policymakers with targeted strategies to foster stability and inclusive development, mitigating the underlying causes of political violence.

Background Study

Our project employs advanced data science techniques to explore the relationship between economic indicators and political violence in the Philippines. Through analysis of comprehensive datasets on political violence and economic metrics, we aim to uncover key drivers and develop predictive models to anticipate outbreaks based on economic shifts. These insights will equip policymakers with targeted strategies to foster stability and inclusive development, mitigating the underlying causes of political violence.

Objectives

  1. To identify and analyze the correlation between various economic indicators (such as the PHP exchange rate, external debt, foreign investment, GDP, GNI, etc.) and the occurrence of political violence in the Philippines.

  2. To understand the underlying factors contributing to the relationship between economic conditions and political violence, including socio-economic disparities, inequality, and grievances.

  3. To promote peace and stability in the community by providing actionable insights to mitigate the occurrence of political violence and contribute to Sustainable Development Goal 16 (Peace, Justice, and Strong Institutions).

  4. To assist the government in addressing the issue of reducing political violence by offering evidence-based recommendations and policy measures informed by data-driven analysis.

Research Hypothesis

Null Hypothesis (H0)

None of the Philippines' economic indicators are correlated with the number of recorded political violence in the country.

Alternative Hypothesis (H1)

At least one Philippine economic indicator is correlated with the number of recorded political violence in the country.

Methods

After formulating our research questions and hypotheses, we have done the following methodology phases to come up with the analysis and potential workarounds for the data obtained regarding the economic factors and amount of political violence incidents.

Data Collection

We looked at publicly available and credible databanks.

Specifically, we looked at ACLED by using their data export tool, and we looked at World Bank's data catalog labeled as Global Economic Monitor.

The dataset includes political violence in the Philippines from 2016 up to the present, which amounts. Each data point records pertinent information on the nature of the political violence: date, time, location, fatalities, and many more.

Exploratory Data Analysis

We utilized time-series spearman cross-correlation to obtain insights from our data.

We utilized the time-series spearman cross-correlation data analysis technique from Kaggle by André Araújo to analyze the correlations between various economic indicators as provided by World Bank and amount of political violence incidents recorded by ACLED.

Further details regarding our Exploratory Data Analysis methodology will be discussed in the dedicated Exploratory Data Analysis section of the website. For the meantime, we used Google Colab to perform the rest of the methodology phases.

Machine Learning Application

We utilized Machine Learning to predict the amount of political violence incidents.

The use of the Random Forest Regression machine learning algorithm helps us in identifying the features of the dataset that are important in predicting the amount of political violence incidents given the values from economic factors and previous readings of amount of political violence incidents.

Further details regarding our Machine Learning Application methodology will be discussed in the dedicated Machine Learning Application section of the website. For the meantime, we also used Google Colab to perform the rest of the methodology phases.

Exploratory Data Analysis

We have done the following steps to perform Exploratory Data Analysis in our dataset and learn about the relationships between the dataset features using time-series spearman cross-correlation with time-lag:

  1. Import data sets with Philippines column filter for economic indicators: Since the dataset used includes other countries that are not part of the scope of our research, we filtered out entries of countries other than Philippines.

  2. Rename columns for the economic indicators using the name of the economic indicators themselves: Each economic indicator datasets has country names as column names, with file name as the economic indicator itself. Since we obtained the Philippines column for each economic indicator dataset, we replaced the said column with the name of the economic indicator since the country column name is of no use anymore.

  3. Create inferred column date in the ACLED dataset before merging: Prior to joining the economic indicator datasets with the ACLED dataset, we created an inferred column named date in the ACLED dataset that conforms to the format in the economic indicator datasets. This would prove useful upon merging the datasets as we used the date column as the key for merging.

  4. Preprocess imported GDP economic indicator dataframes using monthly frequency before merging: The GDP economic indicator dataset has quarterly frequency which makes the date formats in quarterly format, non-conformant to other economic indicator datasets that use monthly frequency for date. Hence, we preprocessed the GDP economic indicator dataset in which for each quarter, we duplicated the GDP value entries and then transformed the date entries of these duplicate entries into months of the corresponding quarter.

  5. Create aggregated economic indicator dataframe for merging: We aggregated the economic indicator datasets into one large economic indicator dataset.

  6. Join economic indicator dataframes into the ACLED dataframe as the main dataframe: We performed dataset merge on the date values of the aggregated economic indicator dataset and the ACLED dataset.

  7. Set Date format to Timestamp for date ordinality: For plotting ordinality purposes, we set the format of the Date column of the aggregated dataset to Timestamp.

  8. Line plot of the number of recorded political violence incidents over time: With the properly-formatted aggregated dataset on hand, we inspect the number of recorded political violence incidents over time using a line plot. Refer to the Plots section for the generated line plot.

  9. Line plot of the economic indicators over time: In addition, we inspect the trend of economic indicators over time using a line plot. Refer to the Plots section for the generated line plots.

  10. Create a new dataframe from the main dataframe with time lags: To utilize time-series spearman cross-correlation with time-lag for analysis, we have to create a new dataset that introduces shifted values for each feature as time lags.

  11. Compute the correlation matrix using spearman cross-correlation and obtain relevant data: Using the corr() function from pandas, we compute the spearman cross-correlation matrix for the aggregated dataset with time-lag. Note that we used the spearman correlation method since we are working with economic data that display various patterns that suggest non-linear yet monotonic relationships.

  12. Obtain correlation submatrices for each economic indicator to the amount of political violence incidents: We truncated the resulting spearman cross-correlation matrix so that we can conveniently analyze relevant correlations (i.e., cross-correlations across each economic indicator and amount of political violence incidents). Hence, cross-correlations across economic indicators only are removed.

  13. Generate heatmaps for the correlation matrices of the relevant data and store to local storage: We used the heatmap display from seaborn to properly display the resulting correlation matrices.

  14. Find the maxima of the positive and negative time-lag cross-correlations for each economic indicator: To help us in answering our research questions, we found the maxima of the positive and negative time-lag cross-correlations for each economic indicator as follows:

    • Minimum: ('CPI Price, nominal, seas. adj._10', 'Amount of Political Violence Incidents_6', -0.8396089332701939)
      Maximum: ('CPI Price, nominal, seas. adj._12', 'Amount of Political Violence Incidents_12', -0.5984041476267742)
    • Minimum: ('Exchange rate, new LCU per USD extended backward, period average_1', 'Amount of Political Violence Incidents_7', -0.4209982755490279)
      Maximum: ('Exchange rate, new LCU per USD extended backward, period average_12', 'Amount of Political Violence Incidents_12', -0.1043715988327789)
    • Minimum: ('Exports Merchandise, Customs, Price, US$, seas. adj._1', 'Amount of Political Violence Incidents_9', -0.6242076932651255)
      Maximum: ('Exports Merchandise, Customs, Price, US$, seas. adj._12', 'Amount of Political Violence Incidents_6', 0.004161519626459359)
    • Minimum: ('Foreign Reserves, Months Import Cover, Goods_1', 'Amount of Political Violence Incidents_12', 0.015309454543574089)
      Maximum: ('Foreign Reserves, Months Import Cover, Goods_1', 'Amount of Political Violence Incidents_8', 0.18926595234408655)
    • Minimum: ('GDP at market prices, current LCU, millions, seas. adj._1', 'Amount of Political Violence Incidents_6', -0.8052479175314142)
      Maximum: ('GDP at market prices, current LCU, millions, seas. adj._12', 'Amount of Political Violence Incidents_12', -0.5035231317052827)
    • Minimum: ('Imports Merchandise, Customs, Price, US$, seas. adj._1', 'Amount of Political Violence Incidents_6', -0.7586318649460851)
      Maximum: ('Imports Merchandise, Customs, Price, US$, seas. adj._12', 'Amount of Political Violence Incidents_9', -0.42842388913564083)
    • Minimum: ('Industrial Production, constant 2010 US$, seas. adj._1', 'Amount of Political Violence Incidents_10', -0.18736170576553524)
      Maximum: ('Industrial Production, constant 2010 US$, seas. adj._8', 'Amount of Political Violence Incidents_12', 0.1545534641178347)
    • Minimum: ('Nominal Effective Exchange Rate_1', 'Amount of Political Violence Incidents_12', -0.24020250670450272)
      Maximum: ('Nominal Effective Exchange Rate_11', 'Amount of Political Violence Incidents_6', 0.2887142837685211)
    • Minimum: ('Official exchange rate, LCU per USD, period average_1', 'Amount of Political Violence Incidents_7', -0.4209982755490279)
      Maximum: ('Official exchange rate, LCU per USD, period average_12', 'Amount of Political Violence Incidents_12', -0.1043715988327789)
    • Minimum: ('Real Effective Exchange Rate_1', 'Amount of Political Violence Incidents_8', -0.6283483810541748)
      Maximum: ('Real Effective Exchange Rate_12', 'Amount of Political Violence Incidents_6', -0.48128835134913067)
    • Minimum: ('Stock Markets, LCU_8', 'Amount of Political Violence Incidents_12', 0.3397139612377343)
      Maximum: ('Stock Markets, LCU_6', 'Amount of Political Violence Incidents_3', 0.5833822744478891)
    • Minimum: ('Terms of Trade_1', 'Amount of Political Violence Incidents_12', 0.3070294908232785)
      Maximum: ('Terms of Trade_1', 'Amount of Political Violence Incidents_6', 0.6561126770679805)
    • Minimum: ('Total Reserves_2', 'Amount of Political Violence Incidents_4', -0.685344567972088)
      Maximum: ('Total Reserves_1', 'Amount of Political Violence Incidents_12', -0.4131325160627711)
    • Minimum: ('Unemployment Rate, seas. adj._12', 'Amount of Political Violence Incidents_1', -0.29727448372735177)
      Maximum: ('Unemployment Rate, seas. adj._1', 'Amount of Political Violence Incidents_7', 0.2656597667189325)

  15. Find the maxima of the positive and negative time-lag cross-correlations for all economic indicators: Using the results from the previous step, we found the maxima of the positive and negative time-lag cross-correlations for all economic indicators, which are as follows:

    • Absolute negative maximum: ('CPI Price, nominal, seas. adj._10', 'Amount of Political Violence Incidents_6', -0.8396089332701939)
    • Absolute positive maximum: ('Terms of Trade_1', 'Amount of Political Violence Incidents_6', 0.6561126770679805)

  16. Line plot the notable results with highest maximum correlation: We line plot the economic factors that have the highest maximum correlation, positive or negative, with respect to the amount of political violence incidents.

Plots

Exploratory Data Analysis

  • All
  • Nutshell Plot
  • Plots With Highest Positive and Negative Correlations
  • Correlation Matrices
  • Line Plots

Nutshell

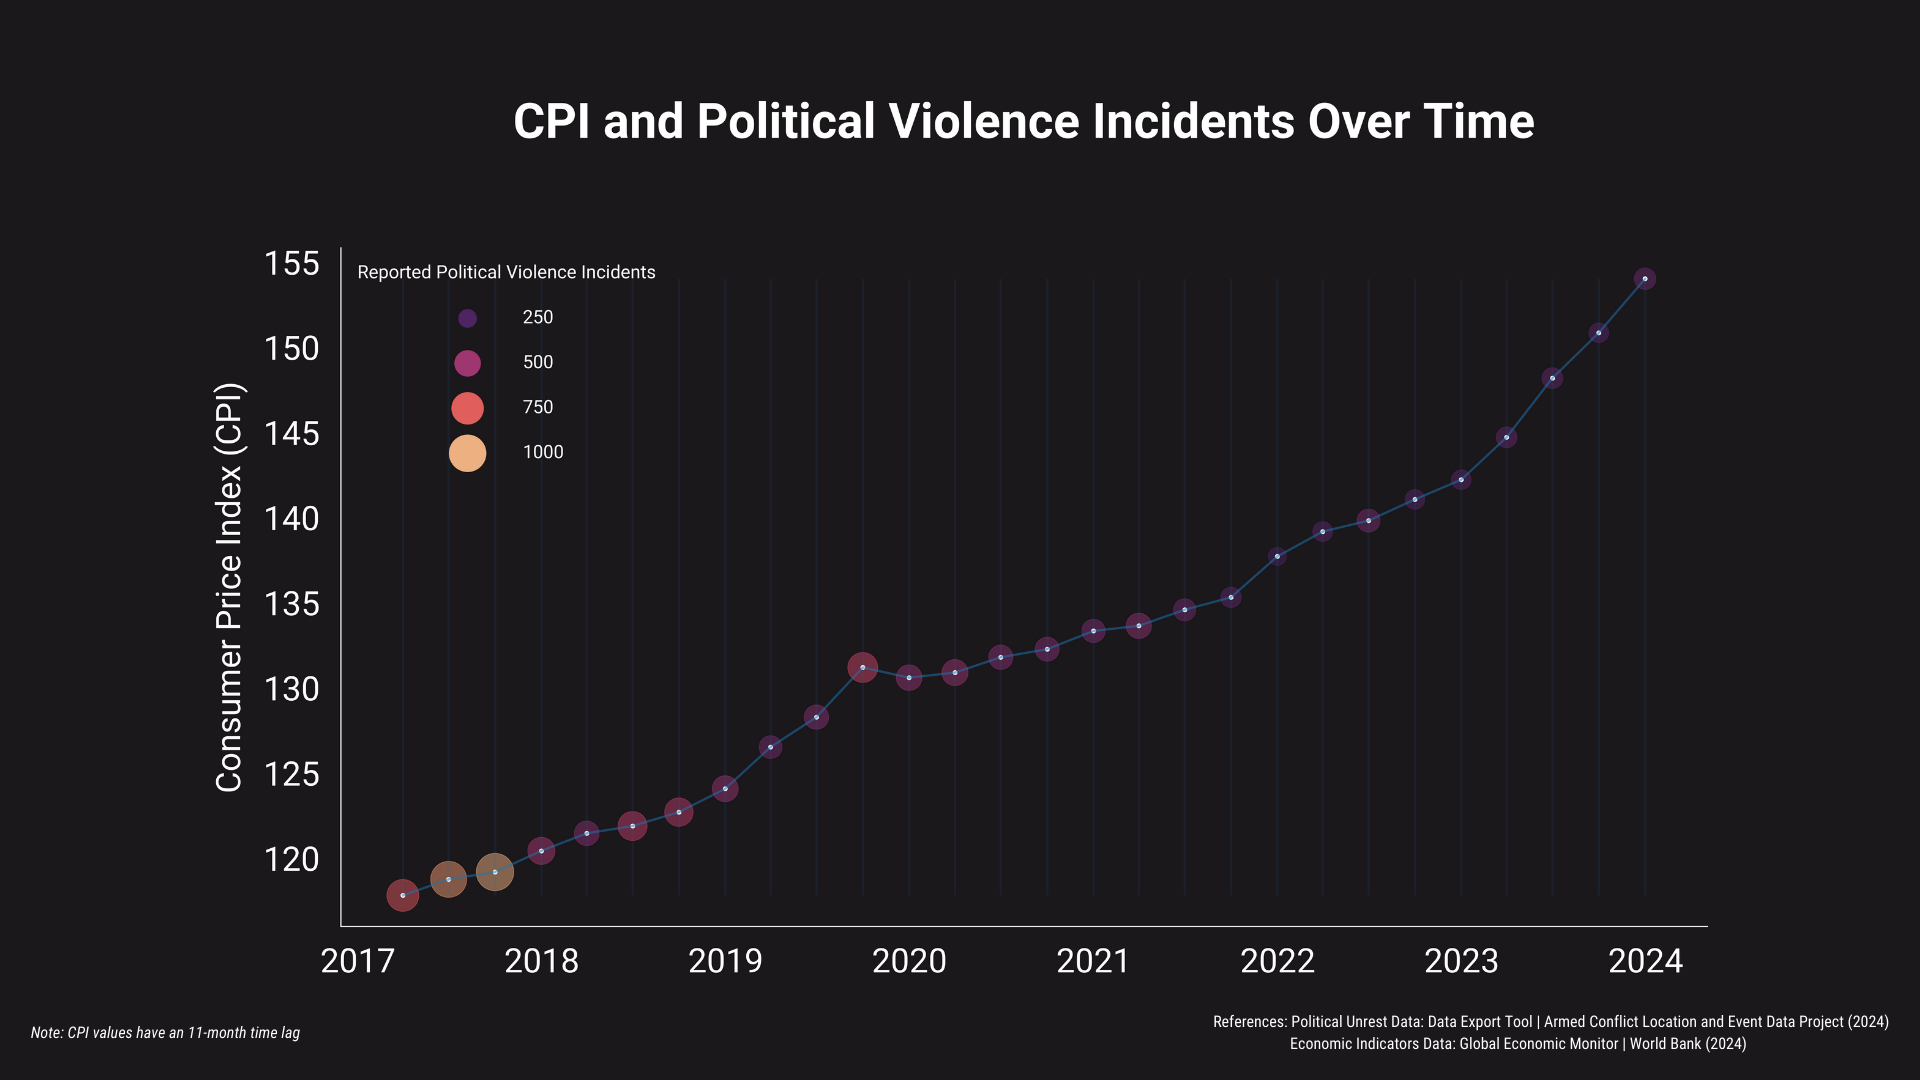
This graph represents the relationship between the reported political violence incidents and the Consumer Price Index (CPI) economic factor. It is shown in the graph that as the CPI trend increases, the number of reported political violence incidents decreases, which shows that there is an inverse relationship between the two variables.

Normalized time series graph between Normalized CPI Price, nominal, seas. adj. and Amount of Political Violence Incidents

The normalized time series plot between CPI price and number of recorded political violence incidents with time-lag. This graph shows the correlation of the economic factor with highest negative correlation to the number of recorded political violence incidents.

Normalized time series graph between Terms of Trade and Amount of Political Violence Incidents

The normalized time series plot between terms of trade and number of recorded political violence incidents with time-lag. This graph shows the correlation of the economic factor with highest negative correlation to the number of recorded political violence incidents.

CPI Price, nominal, seas. adj. time-lag cross-correlation matrix

The correlation between CPI price and time-lag.

Official exchange rate, LCU per USD, period average time-lag cross-correlation matrix

The correlation between official exchange rate and number of recorded political violence incidents with time-lag.

Exports Merchandise, Customs, Price, US$, seas. adj. time-lag cross-correlation matrix

The correlation between exports merchandise and number of recorded political violence incidents with time-lag.

Exchange rate, new LCU per USD extended backward, period average time-lag cross-correlation matrix

The correlation between exchange rate and number of recorded political violence incidents with time-lag.

Foreign Reserves, Months Import Cover, Goods time-lag cross-correlation matrix

The correlation between foreign reserves and number of recorded political violence incidents with time-lag.

GDP at market prices, current LCU, millions, seas. adj. time-lag cross-correlation matrix

The correlation between GDP at market prices and number of recorded political violence incidents with time-lag.

Imports Merchandise, Customs, Price, US$, seas. adj. time-lag cross-correlation matrix

The correlation between imports merchandise and number of recorded political violence incidents with time-lag.

Industrial Production, constant 2010 US$, seas. adj. time-lag cross-correlation matrix

The correlation between industrial production and number of recorded political violence incidents with time-lag.

Nominal Effective Exchange Rate time-lag cross-correlation matrix

The correlation between nominal effective exchange rate and number of recorded political violence incidents with time-lag.

Real Effective Exchange Rate time-lag cross-correlation matrix

The correlation between real effective exchange rate and number of recorded political violence incidents with time-lag.

Stock Markets, LCU time-lag cross-correlation matrix

The correlation between stock markets and number of recorded political violence incidents with time-lag.

Terms of Trade time-lag cross-correlation matrix

The correlation between terms of trade and number of recorded political violence incidents with time-lag.

Total Reserves time-lag cross-correlation matrix

The correlation between total reserves and number of recorded political violence incidents with time-lag.

Unemployment Rate, seas. adj. time-lag cross-correlation matrix

The correlation between unemployment rate and number of recorded political violence incidents with time-lag.

Amount of Political Violence Incidents

Line plot of the number of recorded political violence incidents over time

CPI Price, nominal, seas. adj. line plot

Line plot of CPI Price over time

Exchange rate, new LCU per USD extended backward, period average line plot

Line plot of Exchange rate over time

Exports Merchandise, Customs, Price, US$, seas. adj. line plot

Line plot of Exports Merchandise over time

Foreign Reserves, Months Import Cover, Goods line plot

Line plot of Foreign Reserves over time

GDP at market prices, current LCU, millions, seas. adj. line plot

Line plot of GDP at market prices over time

Imports Merchandise, Customs, Price, US$, seas. adj. line plot

Line plot of Imports Merchandise over time

Industrial Production, constant 2010 US$, seas. adj. line plot

Line plot of Imports Merchandise over time

Nominal Effective Exchange Rate line plot

Line plot of Nominal Effective Exchange Rate over time

Official exchange rate, LCU per USD, period average line plot

Line plot of Official exchange rate over time

Real Effective Exchange Rate line plot

Line plot of Real Effective Exchange Rate over time

Stock Markets, LCU line plot

Line plot of Stock Markets over time

Terms of Trade line plot

Line plot of Terms of Trade over time

Total Reserves line plot

Line plot of Total Reserves over time

Unemployment Rate, seas. adj. line plot

Line plot of Unemployment Rate over time

Machine Learning

Machine learning played a pivotal role in our study, where we trained a supervised model to forecast the number of political violence incidents based on economic indicators such as CPI, GDP, and Real Effective Exchange Rate. We explored various regression models including Random Forest, Gradient Boosting, Neural Network, Ridge, Linear, and Support Vector. Utilizing GridSearchCV, we fine-tuned these models' hyperparameters to enhance their performance.

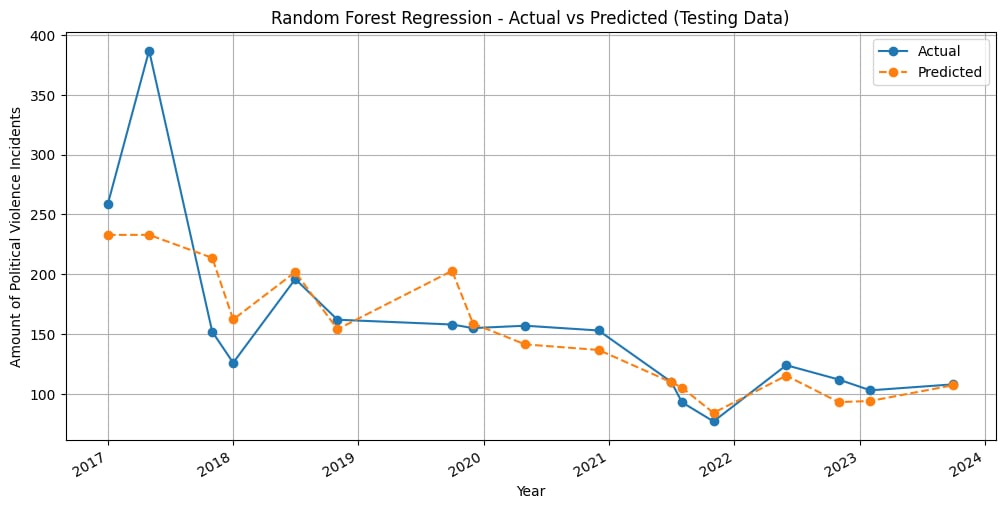
Among these, the Random Forest Regression model delivered the most promising results, boasting a Mean Squared Error (MSE) of 1760.41 and an R-squared of 0.70. MSE quantifies the average squared difference between predicted and actual values, providing a clear measure of prediction accuracy. Meanwhile, R-squared indicates how well the model fits the data, with higher values signifying a better fit. The optimal parameters identified for the Random Forest model were: 'bootstrap': False, 'max_depth': 10, 'max_features': 'sqrt', 'min_samples_leaf': 1, 'min_samples_split': 5, 'n_estimators': 50. Furthermore, it revealed that the most important features include CPI Price, Stock Markets, GDP at market prices, and Real Effective Exchange Rate.

A Random Forest Regressor functions by constructing multiple decision trees, each trained on different subsets of the data and features. These trees collectively predict outcomes, and the final prediction is an average of their individual forecasts. This ensemble method mitigates overfitting and enhances robustness by leveraging the diverse insights from multiple trees, thereby offering more accurate and reliable predictions than individual decision trees alone.

To evaluate our model's effectiveness, we divided the dataset into training (80%) and test (20%) sets. With the trained Random Forest model, we successfully predicted the incidence of political violence incidents based on economic factors. The accompanying plot illustrates the model's performance against the test set, demonstrating its predictive capability.

Limitations

A more robust hyperparameter tuning is recommended in the hope of achieving better models. Moreover, the researchers believe that better models will surely arise from larger datasets of higher quality.

Conclusions

Is there a correlation between the Philippines's economic indicators (PHP exchange rate, internal debt, foreign investment, GDP, GNI, etc.) and the number of recorded political violence in the country?

Yes

In particular, most of the indicators displayed moderate amounts (0.4 to 0.8), yet some only displayed weak to no correlation (0 to less than 0.4), in particular Foreign Reserves, Industrial Production, Nominal Effective Exchange Rate, and Unemployment Rate. CPI Price and GDP at market prices displayed a strong correlation (greater than 0.8), although both of them are negative correlations. Terms of Trade has strongest positive correlation.

Which economic indicator is most correlated with the number of recorded political violence occurred in the Philippines?

Terms of Trade and CPI

Terms of trade displayed the strongest positive correlation with a correlation coefficient of 0.66. Meanwhile, CPI Price displayed the strongest negative correlation with a correlation coefficient of -0.84.

Given the strong correlation between the CPI/GDP ratio and political violence in the Philippines, it's crucial to explore more economic indicators to understand their impact on stability. The negative correlation suggests that economic recessions, shown by a decreasing CPI, might increase political violence. Additionally, the positive correlation between terms of trade and political violence, despite higher terms of trade usually indicating a healthier economy, needs further investigation. Since the unemployment rate isn't a significant factor, focusing on a broader range of data-based indicators can enhance decision-making and policy formulation. By expanding our understanding, we can develop more effective strategies to promote stability and peace in the Philippines.

DataBAEs

Get to know our team.

Brylle Joshua Logrono

Brylle is a 4th year BS Computer Science student at the University of the Philippines Diliman, specializing in Algorithms and Complexity at the Department of Computer Science. Passionate about AI/ML, he's an active member of the UP Center for Student Innovations and leads the content development for our project's website. Beyond coding, Brylle enjoys chess, anime, and reading manhwas.

Aaron Jude Tanael

Aaron is a 4th year BS Computer Science major in the University of the Philippines Diliman. He is the Vice President for Service of the UP Center for Student Innovations Organization and is currently performing his thesis under the Department of Computer Science - Algorithms and Complexity Laboratory. While the whole team works together for this project in every aspect, Aaron is mainly responsible for the data handling. Beyond coding, Aaron enjoys playing competitive online games, engaging in sports and physical recreational activities, watching anime, and reading manga.

Earl Wilbur Nogra

Earl is a 4th year BS Computer Science major in the University of the Philippines Diliman. He is a member of the UP Beta Epsilon Fraternity and is currently performing his thesis under the Department of Computer Science - Algorithms and Complexity Laboratory. While the whole team works together for this project in every aspect, Earl is mainly responsible for the website development. Beyond that, Earl enjoys socializing through various games, sports, and events. His main interests include binge watching shows and traveling.